Turkey’s March consumer price index (CPI) increased by 11.86% annually and 0.57% monthly. On the twelve months moving averages basis…
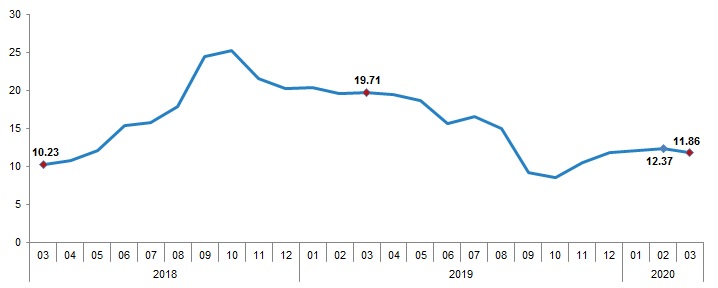
Turkey’s March consumer price index (CPI) increased by 11.86% annually and 0.57% monthly. On the twelve months moving averages basis it stands at 13.33% in March 2020. CPI inflation was 12.37% in February.
Turkey no doubt is taking its share from the global phenomena of the coronavirus related economic shock. As the lockdowns are intensifying along with the spread of the virus across the country, the production is getting a hit and demand is being focused solely on the households’ basic needs. The fact the emerging markets are seeing an unprecedented flee of external funds, the depreciation of the Turkish lira is also adding to the ongoing pressures on the Turkish economy.
Thus, while the 1Q inflation details have been pointing at a steady rigidity of inflation in Turkey as evident from the persistent rise in core inflation, the newly created pressures will start having their toll on the inflation front especially in 2Q20.
The help from the rapid decline in the price of oil is to be nulled with the rapid drop in the value of Turkish lira exerting a sharp rise on the cost side. Yet again, the weak demand that would soon turn imports negative is halting the path of the supply side inflation pressures from building intensely. At the same time, the diminished supply amidst production cuts have already resulted with some extraordinary price adjustments in a number of goods.
With a forward looking perspective, there are complex and multilayered forces taking their toll on Turkey’s inflation path. While the sudden drop in demand and a contracting economy is to cap inflationary pressures, the weak lira and supply side problems along with the central bank’s efforts to enlarge the money base to cope with the liquidity problems will be exerting inflationary forces. All combined, Turkey’s CPI inflation could be expected to float around 10-11% by the end of the year; though the call is subject to revision given the rapid change in the surrounding factors.
Annual CPI (%), March 2020

Looking at the breakdown for the annual CPI, clothing and footwear with 6.18%, recreation and culture with 6.72% and furnishing and household equipment with 7.69% are the main groups where low annual increases were observed. On the other hand, alcoholic beverages and tobacco with 40.19%, miscellaneous goods and services with 17.21% and housing with 15.31% were the main groups where high annual increases are posted.
As per the monthly breakdown, the highest monthly decrease was 1.91% in transportation. Communication also posted mom drop with 0.05%. In contrast, health with 2.78%, food and non-alcoholic beverages with 1.95% and miscellaneous goods and services with 1.24% were the main groups where high monthly increases are seen.

As for the core inflation, the indicator for CPI having specified coverage (B) increased by 11.65% annually versus 11.1% in February and 0.77% monthly.

Domestic producer price index (D-PPI) increased by 8.50% on annual basis, increased by 0.87% on monthly basis. It stands at 12.61% on the twelve months moving averages basis in March 2020.
D-PPI in four main sectors of industry increased by 10.90% for mining and stone quarrying, increased by 7.79% for manufacturing, increased by 18.08% for electricity, gas, steam and air conditioning, increased by 5.51% for water supply, annually.
The indices of main industrial groups; increased by 7.04% for intermediate goods, increased by 11.43% for durable consumer goods, increased by 13.25% for non-durable consumer goods, increased by 1.53% for energy, increased by 9.99% for capital goods, annually.
D-PPI in four main sectors of industry decreased by 0.32% for mining and stone quarrying, increased by 0.91% for manufacturing, increased by 0.99% for electricity, gas, steam and air conditioning, increased by 0.43% for water supply, monthly.
The indices of main industrial groups; increased by 2.03% for intermediate goods, increased by 1.35% for durable consumer goods, increased by 1.76% for non-durable consumer goods, decreased by 6.82% for energy, increased by 2.01% for capital goods, monthly.
As per the more detailed breakdown, the highest rates of annual decrease in D-PPI by subdivisions of industry were the indices for coke and refined petroleum products by 25.70%, for crude petroleum and natural gas by 1.50. On the other hand the highest rates of annual increase in D-PPI by sub divisions of industry were for tobacco products by 46.19%, for metal ores by 20.08%, for electricity, gas, steam and air conditioning by 18.08%.

The highest rates of monthly decrease in D-PPI by subdivisions of industry were index for coke and refined petroleum products by 22.46%, for crude petroleum and natural gas by 14.79%, for tobacco products by 3.74%. On the other hand the highest rates of monthly increase in D-PPI by sub divisions of industry were basic pharmaceutical products and pharmaceutic preparations by 7.71%, for basic metals by 3.39%, for other manufactured goods by 2.90%.