Inflation Expectations and Unemployment: The Facts
 Güldem Atabay
By Güldem Atabay
Summary: Inflation expectations in Türkiye remain stubbornly high despite methodological changes in official surveys that appear to lower headline figures. Meanwhile, the latest labor market data show a decline in the unemployment rate—but largely due to shrinking labor force participation rather than robust job creation. Beneath the surface, structural weaknesses are deepening, particularly in industry and female employment.
Household Inflation Surprise: Method Changes, Expectations Fall
Inflation expectations reflected in the Central Bank of the Republic of Türkiye (CBRT)’s Survey of Market Participants generally track closer to the targets presented in the CBRT’s Inflation Report. Following the latest revision (19–21% target band), market professionals’ expectations hover around 23%, suggesting that the official target is not fully credible.
However, the CBRT’s Sectoral Inflation Expectations survey has long indicated that household and real-sector expectations remain well above official targets. Household expectations are more than double the official target, while real-sector expectations stand near 32%.
According to the latest data, February expectations declined among market participants and the real sector, while household expectations remained unchanged. The 12-month forward inflation expectation fell by 0.1 percentage point to 22.1% among market participants and by 0.9 points to 32% in the real sector. Household expectations stayed flat at 48.8%. Meanwhile, the share of households expecting inflation to decline over the next 12 months dropped by 4.7 points to 20.3%.
A New Survey, A New Design
The Central Bank, in cooperation with TÜİK, has introduced a new data set titled the Household Expectations Survey (HBA). As Professor Selva Demiralp explains:
In the new survey, respondents are shown the current inflation figure before being asked about expectations. This is not a trivial detail. Such a design may lower measured expectations by several percentage points. Therefore, understanding the methodology is essential when comparing this survey to previous ones.
Last month, January household expectations were announced at 52.08%. This month, January was reported at 48.81%. Initially, this appeared to be a data error. However, the earlier figure was derived from the old Consumer Expectations Survey (TEA), while the latest figure was calculated using the new HBA.
The question format also changed—from “How much did prices increase?” to “What will inflation be?” While different question types are common in the literature, HBA includes an additional distinction: respondents are informed about the latest inflation rate before answering.
This “information intervention,” frequently used in experimental economics, is known to reduce expectations. This raises a critical question: Are we measuring “pure expectations,” or expectations adjusted after information is provided?
In essence, part of the recent decline in expectations may reflect survey design rather than genuine improvement in inflation psychology.
Koç University Survey: Expectations Still Elevated
The Koç University Household Inflation Expectations Survey, conducted with the Koç University Data Institute, shows that February 2026 12-month expectations eased slightly from 52% to 50%. Perceived inflation over the past 12 months declined from 62% to 58%.
Although expectations appear to trend downward—excluding the spike following the March 19 arrest of Istanbul Mayor Ekrem İmamoğlu—the level remains far above the 16% official inflation target.
The decline from 68% to 50% over a year may seem substantial, but it still implies a deeply entrenched inflationary mindset.
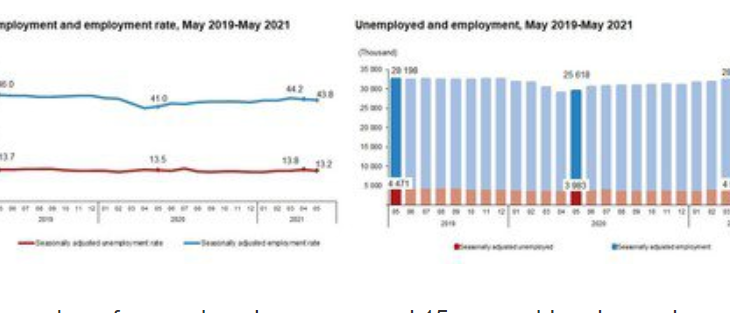
As the Labor Force Shrinks, Unemployment Falls
Seasonally adjusted fourth-quarter 2025 labor force data from TÜİK initially suggest moderate improvement. Employment rose by 136,000 quarter-on-quarter to 32.686 million. The number of unemployed fell by 58,000. The labor force increased by a net 78,000. The unemployment rate declined to 8.2%.
However, the key issue is not the unemployment rate alone, but labor force participation and broader underutilization indicators.
Women Exiting the Labor Market
Quarterly data show male employment rising by 156,000, while female employment declined by 20,000. Female unemployment also fell by 20,000, implying that 40,000 women exited the labor force.
Thus, the decline in female unemployment appears driven not by job creation, but by withdrawal from the labor market.
Sectoral Breakdown: Industry Weakens
Industry, construction, and services saw quarterly gains, while agriculture contracted by 0.7%. Industry rose 1.3% quarter-on-quarter.
However, year-on-year data paint a weaker picture. Compared with Q4 2024:
-
Total employment fell by 35,000
-
Unemployment fell by 146,000
-
The labor force shrank by 180,000
Industrial employment declined by 4.1% year-on-year, while agriculture contracted by 6.3%. Most strikingly, female employment in industry fell by 11.2%.
This is not new. The slowdown that began in 2023 had already flattened industrial job growth. By 2025, outright contraction is evident—and persistent across all quarters.
Construction and services present a mixed picture. Employment stalled in early 2025 but later showed signs of recovery. Growth appears increasingly reliant on these sectors rather than on manufacturing.
Youth Unemployment: Persistent Gender Gap
Seasonally adjusted youth unemployment fell 0.3 points to 14.9%. Young female unemployment declined by 1 point to 20.7%, while young male unemployment rose slightly to 11.8%.
Although the gender gap narrowed from 10 points to 8.9, young female unemployment remains above 20%, highlighting structural gender inequality.
Why the Headline Rate Misleads
Unemployment depends on two variables: the number of unemployed and the size of the labor force. If unemployment falls because people stop looking for work, the rate declines technically—but this does not reflect genuine labor market strength.
Recent data show significant contraction in labor force participation—the sharpest since the Covid period, when uncertainty and health risks drove workers out.
Possible explanations include:
-
Long-term unemployed individuals losing hope
-
Youth failing to transition from education to employment
-
Rising fragility in female employment
-
High inflation and weak real wage growth discouraging participation
Structural Risks to Growth Capacity
Even if GDP appears to be expanding, declining labor force participation weakens potential growth capacity. Türkiye has not experienced a productivity leap driven by digitalization, robotics, or AI. Therefore, reduced participation implies diminished future output potential.
More critically, individuals exiting the labor force often struggle to re-enter. Skill erosion, detachment from formal employment, and informal work expansion can cause lasting damage.
This suggests that actual labor market slack may be broader than official data indicate.
Conclusion: A False Improvement?
The recent unemployment decline may appear positive. However, if the drop reflects shrinking labor force participation rather than robust job creation, it signals contraction—not recovery.
Similarly, falling inflation expectations may partly reflect methodological intervention rather than improved fundamentals.
Headline figures require deeper scrutiny. Beneath the surface, structural fragilities remain.
Related articles

Turkey’s Nuclear Family Model Is Fracturing as Divorces Rise and Single-Person Households Surge

Turkish Bank Lending Trends Q1 2026: Shift Toward Limited Easing

Finance Minister Şimşek Expects Inflation Expectations to Align with CBRT Forecasts as Rates Fall