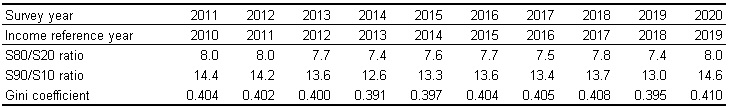
According to TURKSTAT, the income of the richest 10% of the population is 14.6 times higher than the poorest 10%. This figure suggests that the deterioration in income distribution over the last 10 years has reached its peak. The figures are calculated with 2019 fata and do not cover the pandemic effect of 2020. It means that the ongoing deterioration in the distribution of income will become more tangible in 2020. It is understood that wages, the main source of income for the low-income and poor, are eroded by rising inflation, and the richest people with savings protected their assets, especially through their foreign exchange and gold accounts.
The fact that the gap between the two groups has widened so much is the result of the income erosion created by the AKP-MHP government, which chose to provide very limited direct income support during the pandemic period. In light of this study it is not surprising to watch that slide of support for the government as reflected in the polls, as the majority participating in the polls express the most basic problem as the economic trajectory.
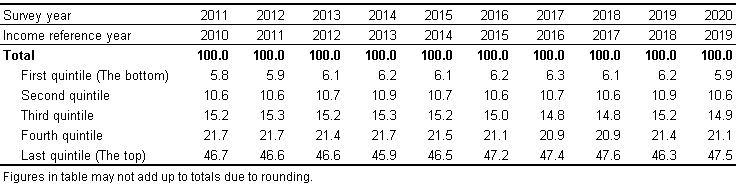
The share of the highest quintile was 47.5% of the total income
The income information regarding the Income and Living Conditions Survey 2020 results refers to the year 2019, the previous calendar year. In the calculation of income, the household’s income is converted into the equivalent household disposable income by taking into account the size and composition of the household.
According to survey results, the share of the top quintile by the equivalised household disposable income was 47.5% recording an increase of 1.2 points whilst the share of the bottom quintile was 5.9% with a decrease of 0.3 points in comparison with the previous year.
Distribution of annual equivalised household disposable income by ordered quintiles (%), 2011-2020
Gini coefficient was 0.410
Gini coefficient one of the measures of income inequality varies between 0, which reflects complete equality and 1, which indicates complete inequality. According to 2020 results, Gini coefficient was estimated at 0.410 with an increase of 0.015 points compared with the previous year. S80/S20 ratio calculated as the ratio of total income received by the richest 20% of the population to that received by the poorest 20% of the population increased from 7.4 to 8.0, while the S90/S10 ratio, which is calculated as the ratio of total income received by the richest 10% of the population to that received by the poorest 10% of the population increased from 13.0 to 14.6.
Income distribution indicators by equivalised household disposable income, 2011-2020
The mean annual household disposable income was 69 thousand 349 TL in 2020 with an increase of 15.8% compared to last year in Turkey.
In Turkey, the mean annual equivalised household disposable income increased by 17.2% compared to the previous year from 28 thousand 522 TL to 33 thousand 428 TL.
According to the household type, the highest mean annual equivalised household disposable income observed among the one person households with 42 thousand 712 TL with an increase of 5 thousand 450 TL compared to last year. The mean annual equivalised household disposable income of the multi-person no-family households 38 thousand 141 TL while this income of the one-family households was 34 thousand 577 TL. The household type with the lowest mean annual equivalised disposable income was extended-family households with 25 thousand 889 TL.
Wages and salaries held the highest proportion of total income with 47.1%
The ratio of wage and salaries got the highest rate with 47.1% of total equivalised household disposable income with an increase of 0.4 points compared with the previous year. This was followed by social transfers 21.8% with a decrease
0.1 points and the entrepreneurial incomes 17.7% without change compared to 2019.
The share of agricultural income in the entrepreneurial income was realized as 20.9% by decreasing 1.7 points compared to 2019. Pensions and survivors’ benefits composed 91.7% of social transfers with a decrease of 0.1 points compared to previous year.
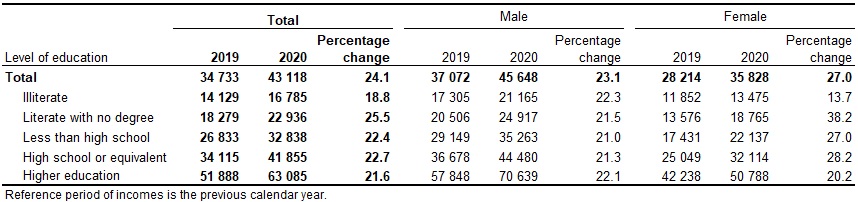
Higher education graduates had the highest mean annual income at main job with 63 thousand 085 TL
Mean annual income at main job was calculated as 63 thousand 085 TL for higher education graduates, 41 thousand 855 TL for high or equivalent school graduates, 32 thousand 838 TL for those with less than high school education 22 thousand 936 TL for those who do not graduate from a school and 16 thousand 785 TL for illiterate individuals. In 2020, compared to 2019, the highest increase in income at main job was observed in the literate with no degree individuals with 25.5% and the lowest increase was in illiterate individuals with 18.8%.
Mean annual income at main job by education status (TL), 2019, 2020
Construction sector held the highest increase of total income with 31.0%
When the mean annual income at main job are analyzed in branch of economic activity; it was observed that the highest mean annual income was in the service sector with 46 thousand 034 TL and the lowest mean annual income was in the agriculture sector with 25 thousand 263 TL. Compared to the previous year; the highest increase in mean annual income was observed in the construction sector with 31.0%, followed by the industrial sector with 26.1%. On the other hand, an increase of 23.9% was observed in the service sector and 15.8% in the agricultural sector.
Employers had the highest mean annual income at main job with 125 thousand 698 TL
Mean annual income at main job was 125 thousand 698 TL for employers, 42 thousand 006 TL for regular employees, 33 thousand 207 TL for self employed workers and 17 thousand 577 TL for casual employees. Compared to the previous year, the highest increase was in employers with 31.6% and the lowest increase was in casual employed workers with 19.0%.
Relative poverty rate was 15.0%
The people having incomes below a specified line compared to the general population is defined to be the poor in a relative meaning. The at-risk-of-poverty-rate according to poverty threshold set at 50% of median equivalised household disposable income was 15.0% with an increase of 0.6 points compared to 2019. As for the at-risk-of-poverty-rate according to poverty threshold set at 60% of median equivalised household disposable income, it was 21.9% with an increase of 0.6 points in comparison with the previous year.
The at-risk-of-poverty-rate according to the poverty threshold set at 40% of median equivalised household disposable income was 8.9% with an increase of 0.6 points compared to the previous year and poverty threshold set at 70% of median equivalised household disposable income was 29.0% with an increase of 0.5 points.
Multi-person no-family households had the lowest poverty rate
Considering poverty rates according to poverty threshold set at 50% of median equivalised household disposable income in terms of household types, at-risk-of-poverty-rate of multi-person no-family households was 9.5% with an increase of 0.3 points, one person households was 10.9% with an increase of 1.7 points, extended family households was 18.4% with an increase of 0.2 points and one-family households was 14.5% with an increase of 0.7 points compared to the previous year.
26.7% of illiterates and 3.2% of higher education graduates were poor
In terms of the at-risk-of-poverty-rate according to poverty threshold set at 50% of median equivalised household disposable income, 26.7% of illiterates and 25.7% of literates with no degree were poor. The figures for less than high school and high school graduates were 14.0% and 8.3% respectively. Higher education graduates were the group with the lowest poverty rate with 3.2%.
Severe material deprivation rate was 27.4%
Material deprivation reflects to perception of households about inability to pay unexpected financial expenses, one week’s annual holiday away from home, mortgage or rent payments, a meal with meat, chicken, fish every second day and heating home adequately warm and the ownership of a washing machine, a color TV, a telephone and a car.
The severe material deprivation rate defined as the rate of people faced with the enforced inability to afford at least four of the above-mentioned items increased from 26.3% in 2019 to 27.4% in 2020.
Persistent at-risk-of-poverty-rate was 13.7%
The persistent at-risk-of-poverty rate shows the percentage of the population living in households where the equivalised disposable income was below the at-risk-of-poverty threshold set at 60% of median equivalised household income for the current year and for at least two out of the preceding three years. In 2020 the persistent at-risk-of-poverty-rate was 13.7% with an increase of 1.0 point in comparison with the previous year.
The share of people living in their own dwellings was 57.8%
In 2020, the proportion of the population living in their own dwellings decreased by 1.0 point compared to the previous year, it was calculated as 57.8% while the share of those living in rented house was 26.2%, the share of those living in lodging was 1.2% and the share of those who did not pay rent despite not living in their own dwellings was 14.7%.
Inability of heating due to isolation was the most common housing and environmental problem
According to the 2020 results 36.7% of the non-institutional population had heating problem due to isolation. This ratio was calculated 34.7% for population faced with problems in their dwellings such as leaking roof, damp walls/floors/foundation, rot in window frames/floors and 22.6% for population had pollution, grime due to traffic/industry or other environmental problems.
The percentage of people having installments or loans was 58.3%
58.3% of the population had installments or loans (other than mortgage -for the main dwelling- and housing cost), 12.8 points less than last year. While these payments did not burden at all to 7.0% of the population, it was a heavy burden to 18.8%. 59.3% of the households reported that they cannot afford paying for one week annual holiday away from home, 37.3% of them cannot afford a meal with meat, chicken or fish every second day, 32.2% of them cannot afford unexpected financial expenses, 20.3% of them cannot afford keeping home adequately warm and 58.0% of them cannot afford replacing worn furniture.