
Following record lows stemming from pandemic related isolation in April and a moderate improvement in May, we saw a rapid increase in industrial production in June. The reasons behind the improvement in June are purchasing managers indices and exports figures:
According to unadjusted figures, Industrial Sector PMI Index (SAMEKS) increased to 49.7 in May and to 56.7 in June following record low levels of 25.4 in April. Figures lower than 50 level point out contraction compared to the previous month in the sector. According to the calendar and seasonally adjusted figures, the index navigated from 29.7 in April to 44.6 in May and to 51.6 in June. New orders sub-index increased by 9.8 points m/m to 52.8, input purchases sub-index increased by 9.0 points m/m to 57.5, production sub-index increased by 8.5 points m/m to 49.2 and employment sub-index increased by 13.5 points m/m to 58.1 in June.
IHS Markit Turkey Manufacturing PMI index increased to 53.9 in June, from levels of 33.4 in April and 40.9 in May. Like SAMEKS index, levels above 50 in ISO Markit PMI index refer to growth in the sector compared to the previous month. Although new orders increased in June, rate of increase in new export orders fell behind total new orders. Furthermore, both employment and purchasing activity increased in June. However, inventories decreased due to the use of existing stocks in the same period.
The factor that pulled down the SAMEKS and ISO PMI indices was the decrease in delivery times sub-index. This demonstrated that disruptions in the supply chain continue. However, depreciation in Turkish lira in June resulted in rise in both input costs and thus selling prices, and output charges increased at the fastest pace in the last three months.
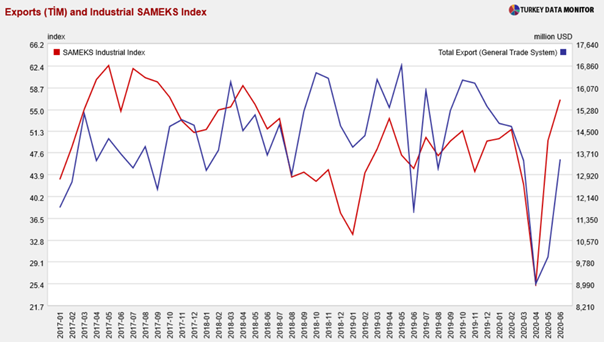
According to TİM (Turkish Exporters Assembly) export figures compiled by the General Trade System increased to 13,469 million dollars in June following 8,993 million dollars in April and 9,964 million dollars in May. You can see the figures of Industrial Sector SAMEKS and TİM export figures for the last 3.5 years. (Chart at cover)
While the main export sector was Apparel sector in period of 2000-2006, Motor Vehicles and Spare Parts sector have accelerated, too. Automotive sector exports, which fell to $596 million in April increased to 1.2 billion in May and to 2,0 billion dollars in June. However, the exports performance in June is below the March figures.
Although export sectors got momentum in June, they are still behind the average of 2019 figures. Performance of the leading export sector, Motor Vehicles and Spare Parts, is at the levels seen in the period of 2013-2015 yet.
And finally, we consider the services sector with the help of Services Sector SAMEKS Index and import figures in June. Services Sector SAMEKS Index increased by 0.5 points to 42.4 which means that the contraction in the sector continued in June at a slower pace compared to the previous month. The reason behind the rise is the input purchases sub-index increasing by 3.4 points to 50.1 in June. Furthermore, according to the Ministry of Commerce foreign trade figures in June, imports of intermediate and investment goods increased in June compared to the previous month. When we consider ISO PMI figures indicating pace of exports orders falling behind total orders, the rise in imports of intermediate and investment goods supports the rise in input purchases for both supplying export orders and input stocks. Excluding increasing gold imports in June, retail sales figures of June due in August will show the other reasons behind the rise in domestic orders.
On the other hand, it is clear that the rising of credit volume which began in the second half of 2019, continuing YTD will support economic growth in the second quarter of 2020. However, any delay in the growth engine of the services sector activity, which is the engine of the economic growth, and increasing price levels may result in weakening of purchasing power.
Let me bring it to your attention; while the ratio of non-performing loans to total loans is at 4.8% in May, the of ratio of expected loss provisions to total loans is at 5.3% in the same period. Despite the fact that the ratio of non-performing loans to total loans was at 5.7% in December 2019 and the of ratio of expected loss provisions to total loans was at 5.5% in January 2020, and decreased from these levels in May, trend in non-performing loans would not exhibit an optimistic outlook for the banking sector should deterioration of the income distribution continue.
Dr. Fulya Gürbüz
You can follow our English language YouTube videos @ REAL TURKEY: https://www.youtube.com/channel/UCKpFJB4GFiNkhmpVZQ_d9Rg
And content at Twitter: @AtillaEng
Facebook: Real Turkey Channel: https://www.facebook.com/realturkeychannel/